

2026 Mid-Year Outlook
Key Takeaways
- Although volatility is expected to remain high, we still have a positive outlook for stocks going into the back half of 2026 due to the strong capex cycle, profit margins, and stable labor market that will prop up lower than average consumer spending.
- The conflict in the Middle East and potentially recurrent spikes in oil prices will keep risks skewed to the upside in yields and the Fed in a hawkish stance; we prefer the 2- to 5-year part of the Treasury yield curve as a result.
- Our expectations for gold have tempered for the next 6-12 months given headwinds with the rise in yields even though long-term fundamentals remain strong due to central banks diversifying reserves away from the dollar into gold.
- In alts we particularly like infrastructure given the funding needs and the general inflation protection the asset class offers, while not being fans of private credit given the recent write downs and lack of compensation for the risks investors are taking.
Markets have received an elevated level of geopolitical uncertainty to sort through in 2026, leading to numerous spikes in volatility and intra-day declines. Yet, as we sit back and tally up asset class returns, we find that most major asset classes have generated positive returns. Large cap stocks are up over 9.5%, small cap stocks are up 19.9%, international stocks – both developed and emerging – are up 11.5%, and bonds are roughly flat, up 0.3% for the year. The asset that has been a notable exception this year is gold, down -7.0%; this is mostly due to the rise in yields and expectations for Fed rate hikes as gold prices tend to go down when rates rise (and vice versa).
Although higher yields, inflation concerns, and geopolitical risks are likely to lead to sustained volatility, resilient corporate profit margins, strong capex, and a stable labor market support our positive outlook going into the second half of 2026. We favor large cap equities, emerging market stocks, and the 2- to 5-year end of Treasury yield curve, while remaining cautious on small cap equities, rate-sensitive assets, and private credit. Meanwhile, we are neutral on gold as it faces headwinds over the near-term while long-term fundamentals hold steady.
US Equities
The stock market’s elevated valuation reflects a debate at the heart of today’s investing landscape: are the revenue expectations for AI capex and the anticipated pickup in productivity going to come to fruition, or are expectations becoming detached from reality? This is especially relevant to think through as the S&P 500 is trading near the upper end of its historical forward P/E range.
S&P 500: Forward P/E Ratio
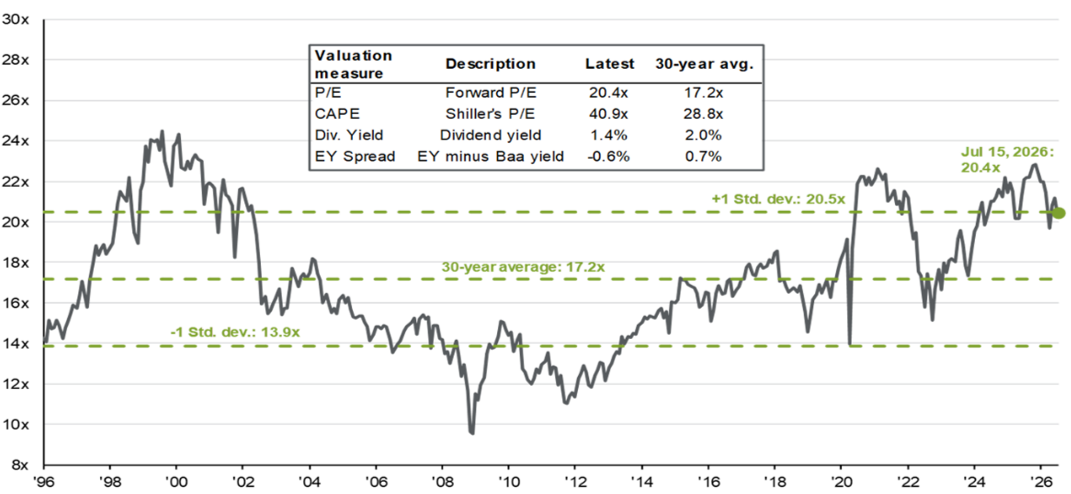
Source: Bloomberg, FactSet, Moody’s, Refinitiv Datastream, Robert Shiller, Standard & Poor’s, J.P. Morgan Asset Management Guide to the Markets. Data as of July 2026.
However, unlike the late-1990s technology cycle, current market leadership is supported by substantial earnings, and free cash flow. Profit margins are near all-time highs at 15.1%, while consensus estimates continue to point to strong earnings growth as companies invest in technology and improve operating efficiency. We remain constructive on U.S. equities, although elevated valuations reinforce the importance of active management.
The stocks near all-time highs reflect record profit margins and revenues.
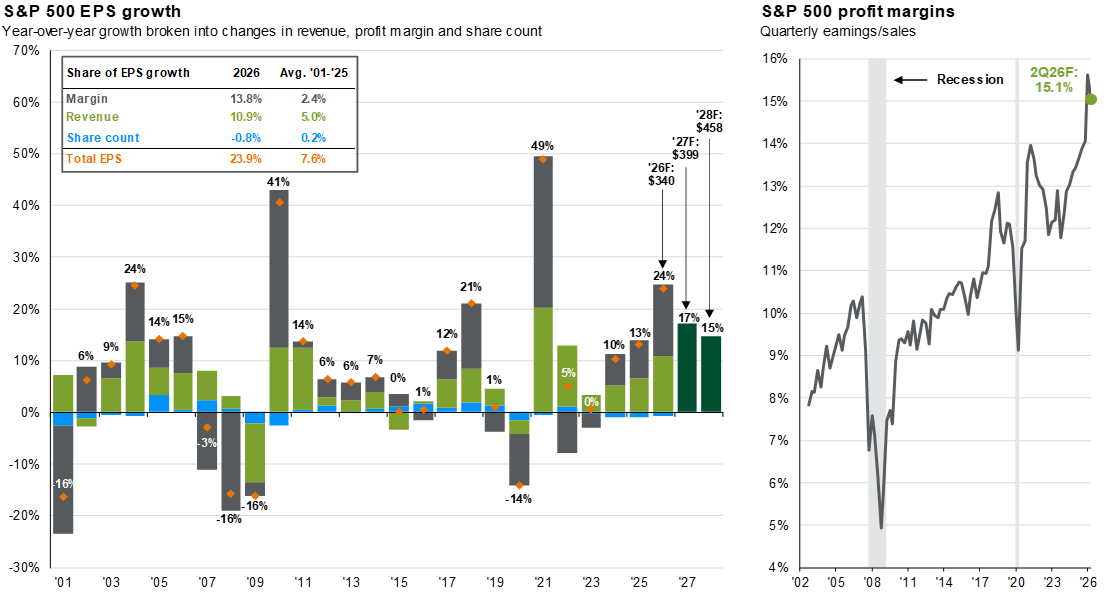
Source: Compustat, FactSet, Standard & Poor’s, J.P. Morgan Asset Management. Historical EPS values are based on annual earnings per share. Forecasts for 2026, 2027 and 2028 reflect consensus analyst expectations, provided by FactSet. Past performance is no guarantee of future results. Guide to the Markets – U.S. Data are as of July 15, 2026.
Although value has outperformed growth year to date, we find growth companies in technology and communication services attractive. Earnings remain strong at 50% year over year growth with an upward revision in expectations of 15%, yet valuations have improved with multiples declining -7%. We also see opportunities in industrial and power-related companies positioned to benefit from sustained investment in data centers, grid capacity and AI infrastructure. As the investment cycle matures, we expect greater dispersion between companies that successfully monetize AI investment and those whose valuations depend on more optimistic assumptions.
AI Related Industry Returns, Earnings Growth, and Forward Valuations
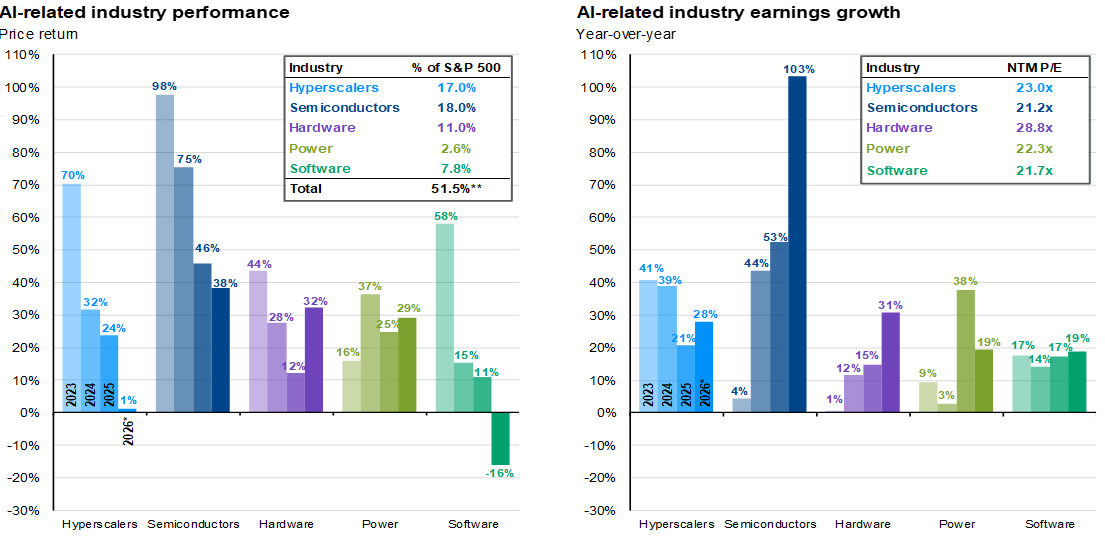
Source: FactSet, MSCI, Standard & Poor’s, J.P. Morgan Asset Management. 2026 price return is year-to-date, and earnings growth reflects 2026 consensus estimates as provided by FactSet. Hyperscalers is a market-weighted composite of AMZN (Sector = Con. Disc, Industry = Broadline Retail), GOOGL/GOOG (Comm. Svcs., Interactive Media & Scvs.), META (Comm. Svcs., Interactive Media & Scvs.), MSFT (Info. Tech., Software) and ORCL (Info. Tech., Software). The remaining categories are based on GICS Industries. Semis = Semiconductors & Semiconductor Equipment (Info. Tech.); Hardware = market-weighted composite of Communications Equipment (Info. Tech.), Electronic Equipment Instruments & Components (Info. Tech.) and Technology Hardware Storage & Peripherals (Info. Tech.); Power = market-weighted composite of Electrical Equipment (Industrials) and Electric Utilities (Utilities); Software = Software (Info. Tech.). Hyperscalers that fall in category industries are included in both the hyperscaler and that additional category. **Total percentage in the S&P 500 does not double count hyperscalers that fall in additional categories. Past performance is no guarantee of future results. Guide to the Markets – U.S. Data are as of July 15, 2026.
Within value, we favor financials, supported by improving capital-markets activity, healthy merger and acquisition volumes, and earnings growth of approximately 20% year over year. Conversely, we are limiting exposure to rate-sensitive real estate, where higher financing costs remain a headwind.
Small-cap equities have generated strong year-to-date returns, but the fundamental backdrop remains challenging. Approximately 41% of the index is unprofitable, consensus earnings estimates have been revised downward by an average of 21%, and profit margins remain broadly flat. Smaller companies also tend to have less pricing power and fewer economies of scale, making them more vulnerable to persistent inflation and elevated financing costs. We therefore continue to favor large caps, supported by stronger balance sheets, higher margins, and greater operating flexibility.
Small-cap profit margins have remained flat or decreased in recent years.
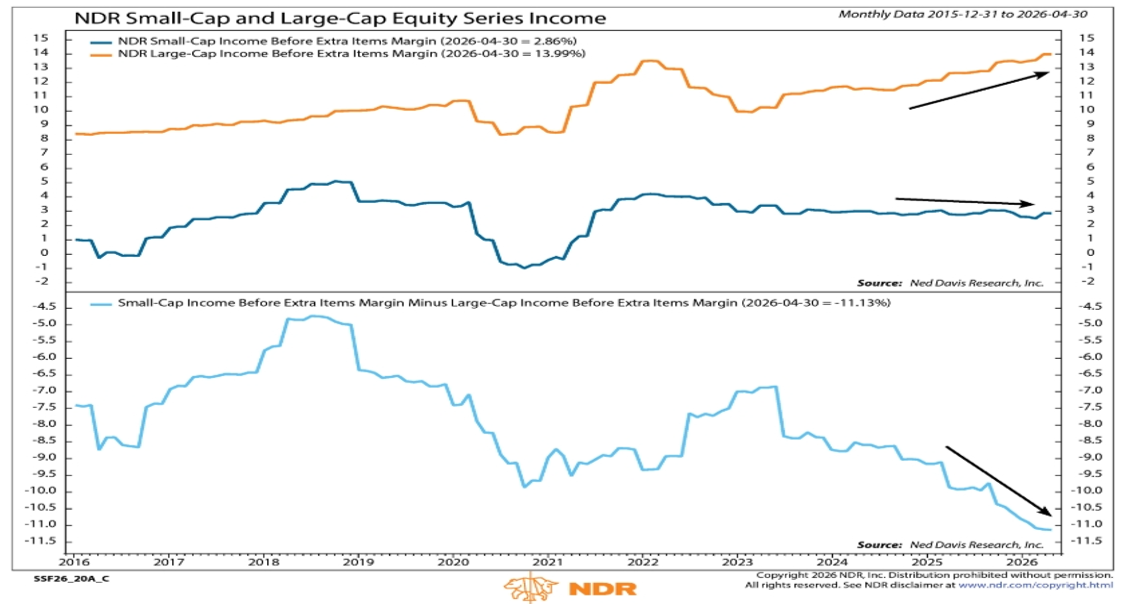
Source: Ned Davis Research. NDR Small Cap and Large Cap Equity Income Series. Monthly data as of 4/30/2026.
The key risk we are watching in equities markets is the record use of margin debt and leveraged exchange-traded funds as elevated leverage could amplify volatility during a pullback. This does not alter our constructive base case, but it increases the potential magnitude of short-term volatility and reinforces the importance of portfolio diversification.
International Equities
Developed international equities face a more difficult second-half backdrop as higher energy prices pressure energy-dependent economies, particularly in Europe, and contribute to a more restrictive European Central Bank policy outlook. Against this backdrop, we favor large-cap growth companies with stronger balance sheets, greater pricing power, and the ability to absorb higher input and financing costs. We are also constructive on industrial companies positioned to benefit from increased defense spending, energy infrastructure investment, and European grid modernization, which may provide a source of earnings growth even if broader economic activity slows.
International Equity Returns Driven by Earnings Growth
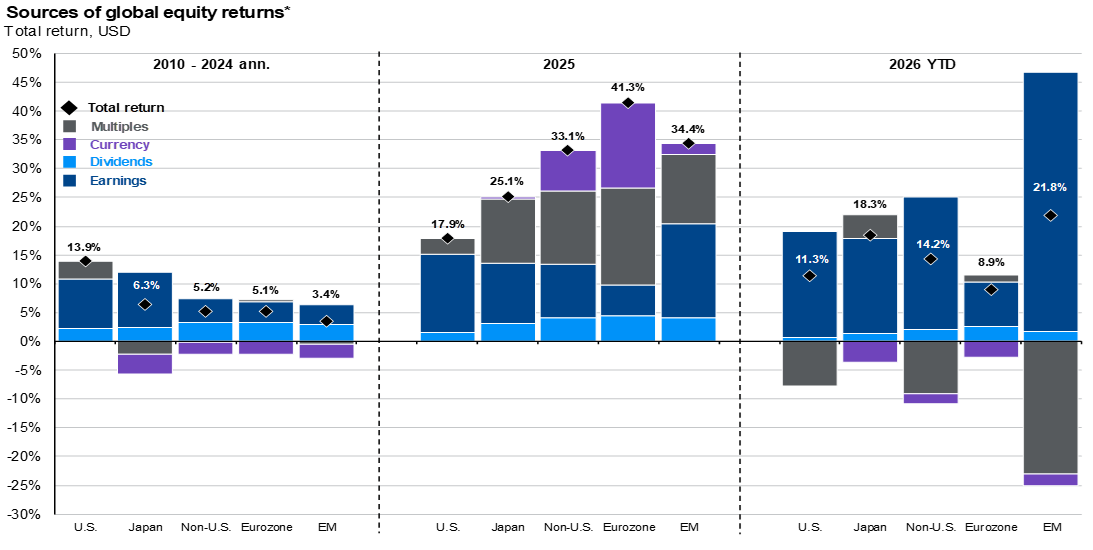
Source: FactSet, MSCI, Standard & Poor’s, J.P. Morgan Asset Management. All return values are MSCI Gross Index data, except the U.S., which is the S&P 500. Non-U.S. is MSCI AC World ex USA Index. *Multiple expansion is based on the forward P/E ratio, and EPS growth outlook is based on next 12 months earnings estimates. Chart is for illustrative purposes only. Past performance is no guarantee of future results.
Emerging Markets
We remain constructive on emerging markets, where earnings growth has outpaced valuation expansion. Forward earnings expectations have increased approximately 36%, driven primarily by Taiwanese and South Korean technology leaders at the center of the global AI supply chain. Hardware-heavy companies have contributed nearly 70% of the asset class’s return this year, demonstrating the strength of semiconductor and advanced-electronics demand while also highlighting the concentration of recent market leadership.
Our outlook on China remains mixed as policymakers address persistent fiscal and economic challenges. Over the longer term, the country may benefit from the next phase of AI adoption through industrial automation and advanced manufacturing.
More broadly, improved capital allocation and shareholder alignment across portions of the emerging-market universe make us more constructive on emerging market stocks. With the asset class advancing more than 29% year to date despite multiple compression exceeding 20%, recent performance has been driven primarily by earnings growth rather than expanding valuations.
Valuations by region/country
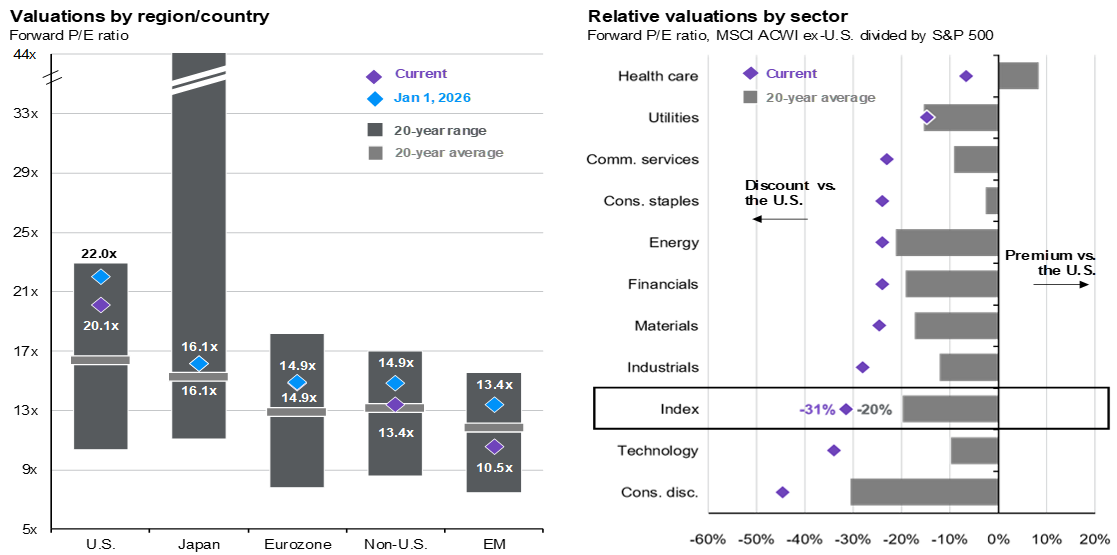
Source: FactSet, MSCI, Standard & Poor’s, J.P. Morgan Asset Management. Countries are represented by their respective MSCI country index except for the U.S., which is represented by the S&P 500. Guide to the Markets – U.S. Data are as of July 20, 2026.
Fixed Income
Yields have risen across the board year to date, and with it, pushed bond prices down. The saving grace has been the coupon payments that have provided a buffer to the pullback in prices, resulting in the asset class being flat for the year. The shape of the Treasury yield curve also changed on the front end – the inversion out to 3 years that existed going into the year is gone as the markets shifted from pricing in rate cuts to a rate hike. With most of the rise being centered around the 2- 5-year mark, we find this part of the Treasury curve most attractive as it capitalizes on higher yields and keeps exposure to any further rise in rates generally lower.
Yields moved up across the curve
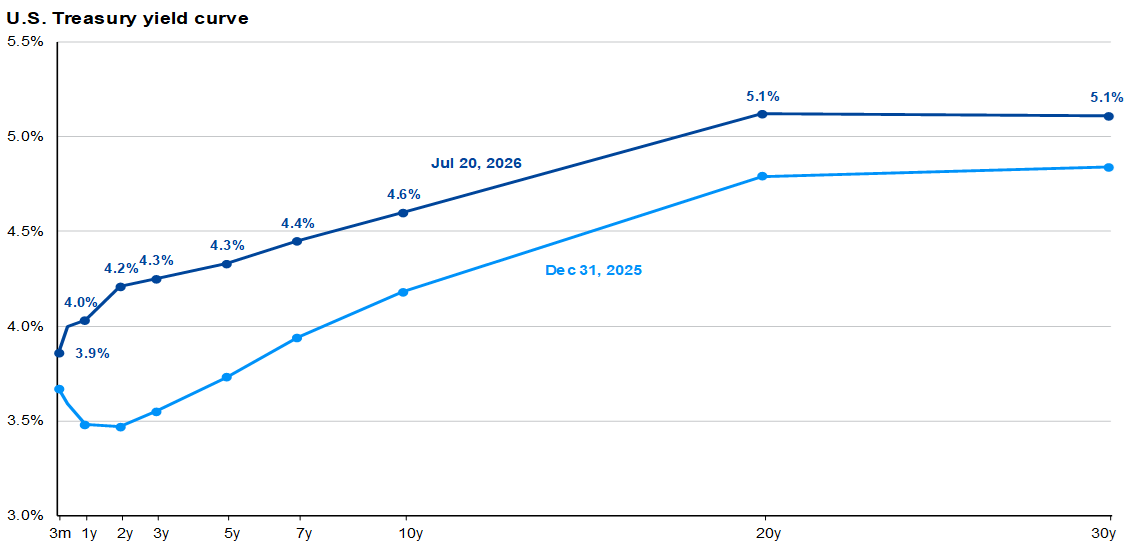
Source: FactSet, Federal Reserve, J.P. Morgan Asset Management. Guide to the Markets – U.S. Data are as of July 20, 2026.
Higher yields generally translate into better forward-looking returns over the next five years. Starting yields typically explain about 89% of the subsequent fiver year returns. On an annualized basis, a yield of 4.82% implies a return of 4.88%. Although we expect near-term headwinds and there to be upside in yields for the remainder of the year, we do see current yields as an attractive entry point for investors.
Higher yields typically translate to better returns over the long-run
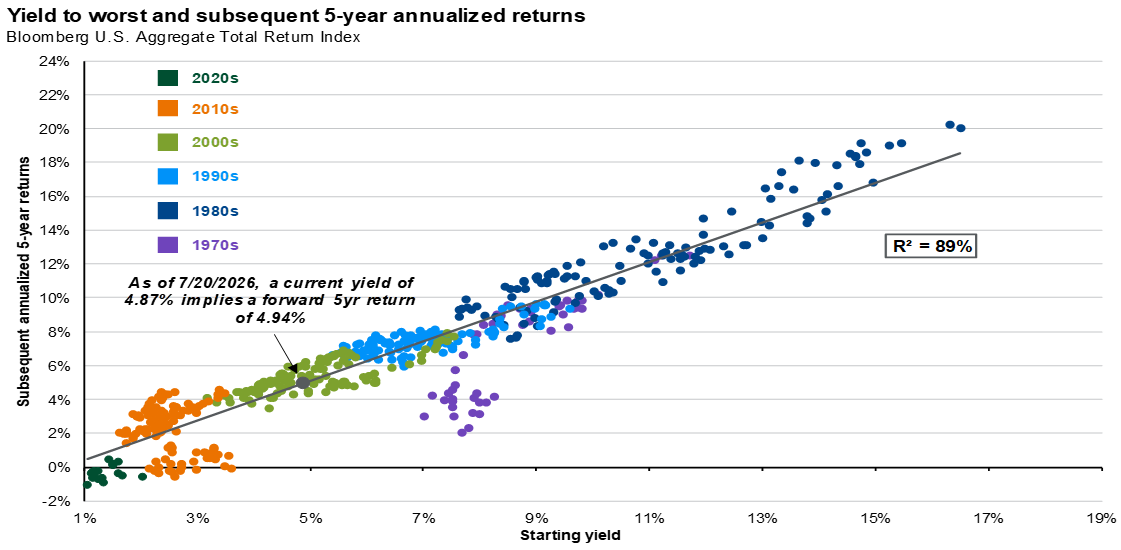
Source: Bloomberg, FactSet, J.P. Morgan Asset Management. Returns are 60-month annualized total returns, measured monthly, beginning 1/31/1976. R² represents the percent of total variation in total returns that can be explained by yields at the start of each period. Past performance is no guarantee of future results. Guide to the Markets – U.S. Data are as of July 20, 2026.
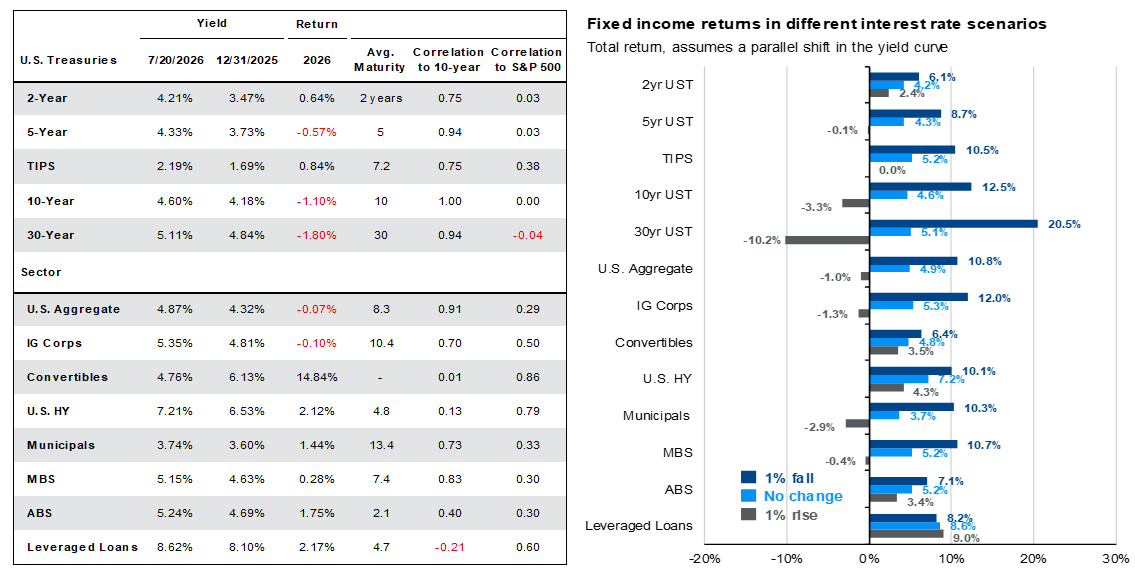
Within the sub-asset classes of fixed income, performance has been a story centered around two drivers: what is the current yield and duration for that asset class? High yield has benefited from yields north of 7% and lower interest rate sensitivity to changes in yields. Meanwhile, investment grade credit’s exposure to movements in interest rates has pulled prices lower and muted returns.
Fixed income yields, returns, and interest rate sensitivity.
Source: Bloomberg, FactSet, Federal Reserve Bank of Cleveland, Standard & Poor’s, U.S. Treasury, J.P. Morgan Asset Management.
Sectors shown above are provided by Bloomberg unless otherwise noted and are represented by – U.S. Aggregate; MBS: U.S. Aggregate Securitized – MBS; ABS: J.P. Morgan ABS Index; IG Corporates: U.S. Corporates; Municipals: Muni Bond; High Yield: Corporate High Yield; Leveraged Loans: J.P. Morgan Leveraged Loan Index; TIPS: Treasury Inflation-Protected Securities; Convertibles: U.S. Convertibles Composite. Convertibles yield is as of most recent month-end and is based on U.S. portion of Bloomberg Global Convertibles Index. Yield and return information based on bellwethers for Treasury securities. Yields shown for TIPS are real yields. TIPS returns consider the impact that inflation could have on returns by assuming the Cleveland Fed’s 1-year inflation expectation forecasts are realized. Sector yields reflect yield to worst. Leveraged loan yields reflect the yield to 3-year takeout. Correlations are based on 15 years of monthly returns for all sectors. ABS returns prior to June 2012 are sourced from Bloomberg. Past performance is no guarantee of future results.Guide to the Markets – U.S. Data are as of July 20, 2026.
We like short-term fixed and floating rate bonds right now to minimize interest rate sensitivity while the market navigates recurrent spikes in oil prices. The bar chart above demonstrates the impact of a 1% rise in yields for a variety of types of bonds in gray – short-term fixed rate and floating rate leveraged loans tend to perform the best in a rising rate environment. High yield also holds up well; yet, we are neutral on high yield because the spread over Treasuries is near historical lows, and we are concerned about declining credit quality at this point in the cycle.
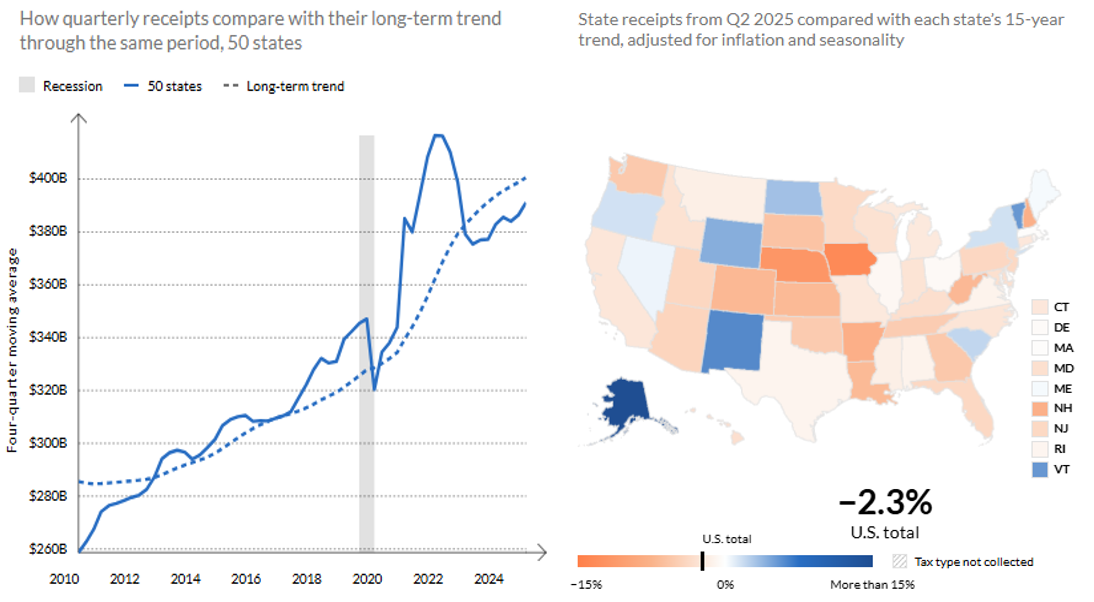
We still find municipal bonds (munis) attractive for clients in a high tax bracket as yields on an after-tax basis are more attractive than Treasuries around 5 years and out. Within Munis, essential service revenue bonds are outperforming general obligation bonds, returning 2.44% vs. 2.02% respectively as of June 30, 2026. We are closely monitoring the recent decline in rainy day savings balances, the 2.3% below trend inflation adjusted total state tax revenue, and persistent budget pressures between declining Federal grants (especially in Medicaid) and approved higher wage increases. Roughly 50% of states already have budget deficits with others attempting to curb spending or raise taxes to avoid budget deficits. That said, we are nowhere near 2008 levels.
Inflation adjusted state tax revenue is below trend on average.
Source: Pew. State Tax Revenue Stabilizes Amid Rising Fiscal Uncertainty. Data as of Q2 2025.
Commodities
Within commodities, we maintain a neutral near-term view on gold while preserving its strategic role, and we continue to view energy as a hedge against geopolitical disruption and renewed inflation pressure.
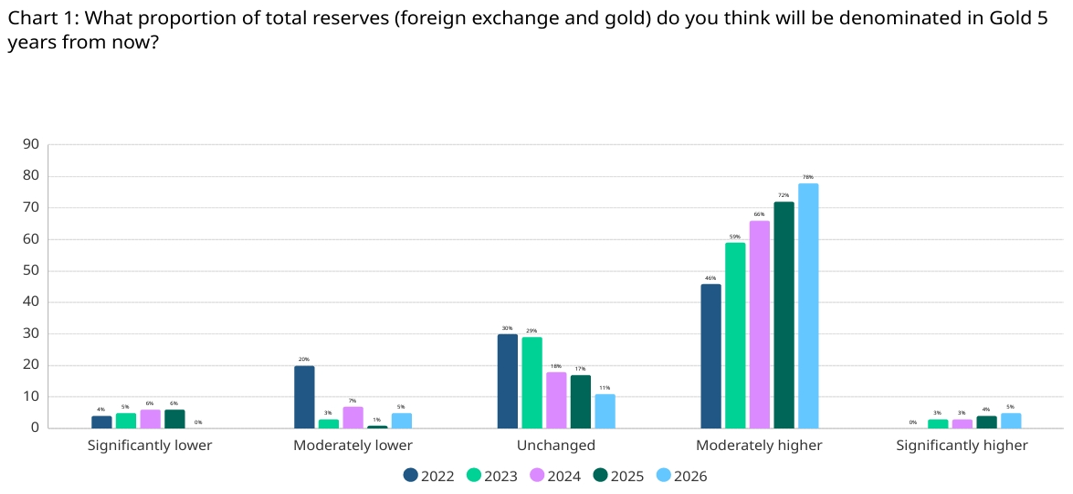
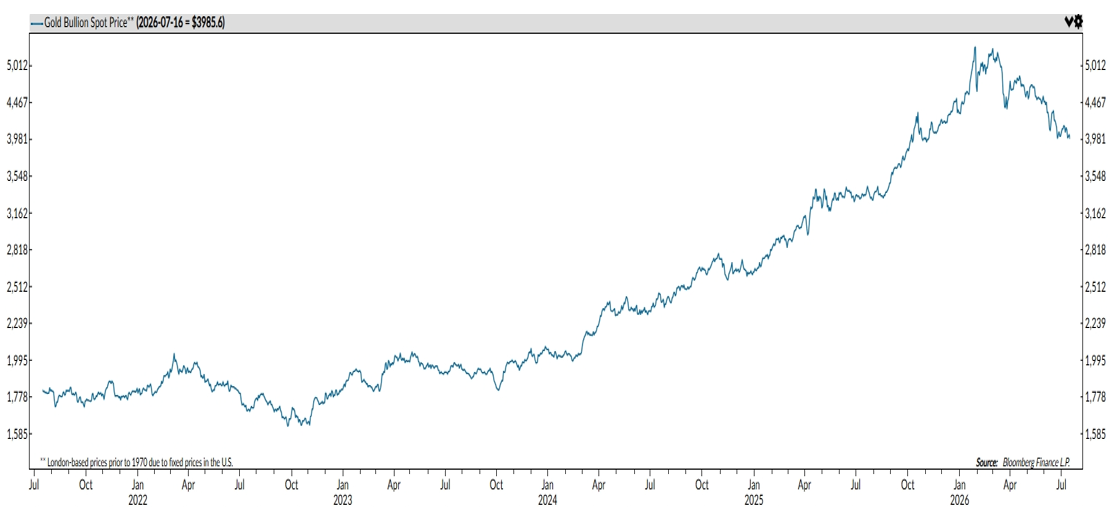
We have shifted from bullish to neutral on gold over the next six to twelve months as higher yields and the possibility of additional monetary tightening create near-term headwinds. Central-bank demand remains supportive but may moderate, with 45% of central banks surveyed expecting to be net purchasers over the next twelve months, compared with 43% in 2025 and 29% in 2024.
Central Bankers Expectation for Gold’s % of Reserves
Source: YouGov, World Gold Council. 2026 base: all central banks (73); advanced economy (17), EMDE (56). 2025 base: all central banks (73), advanced economy (15), EMDE (58). 2024 base: all central banks (68), advanced economy (23), EMDE (45). 2023 base: all central banks (57), advanced economy (13), EMDE (44). 2022 base: all central banks (56), advanced economy (13), EMDE (43). As of 2026.
The longer-term case remains intact. Eighty-three percent of surveyed central banks expect gold to represent a larger share of reserves five years from now, while approximately 74% expect the U.S. dollar’s share to decline. We therefore recommend maintaining existing strategic allocations and would view the weakness as a potential entry point for investors without current exposure.
Gold prices have pulled back but are still in a long-term uptrend.
Source: Ned Davis Research. Gold Bullion Spot Price July 2021-July 2026.
Oil remains an effective hedge against geopolitical disruption in the Middle East. Brent prices have recently rebounded as tensions involving the United States and Iran have intensified, while the downward-sloping futures curve indicates that the market expects prices to moderate over time. A renewed disruption to energy infrastructure or shipping routes remains an important upside risk to prices.
Brent crude oil futures curve ($/bbl)
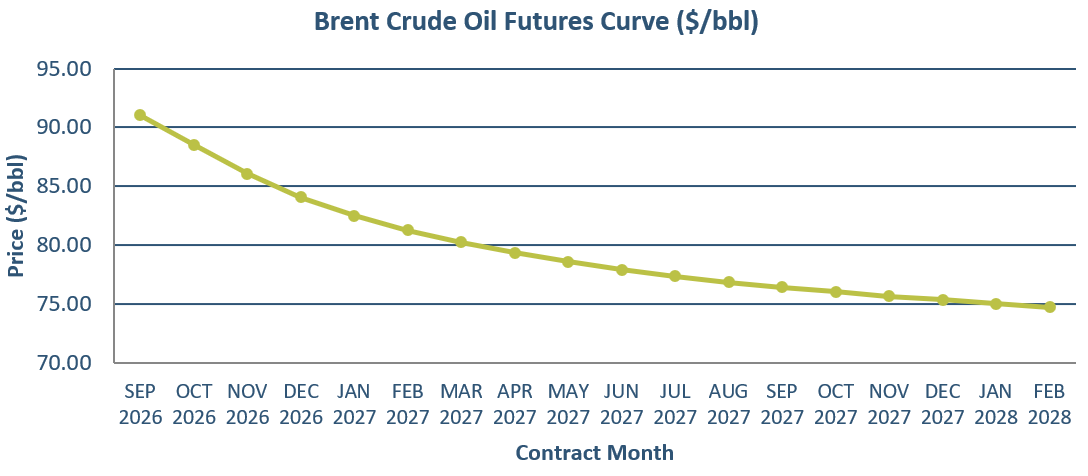
Brent Cude Oil Futures Price as of July 22, 2026. Source: CME Group
Limited spare capacity in strategic reserves may reduce the market’s ability to absorb a prolonged supply shock. Given continued uncertainty surrounding regional infrastructure and the Strait of Hormuz, we believe energy retains value as both a portfolio diversifier and an inflation hedge.
US Crude Oil Inventory, Price, and Consumption
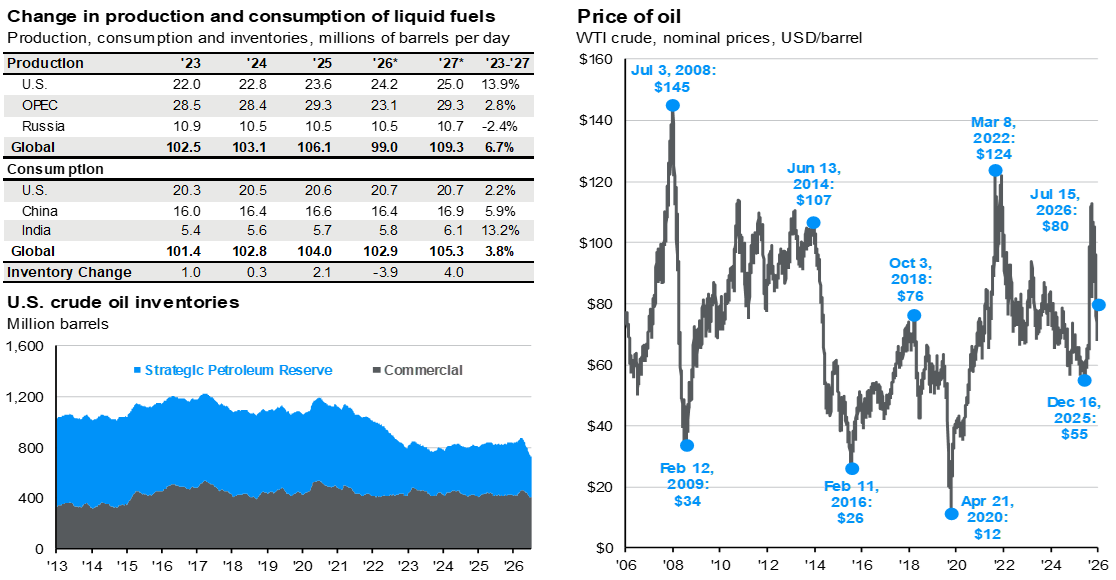
Source: FactSet, J.P. Morgan Asset Management; (Top and bottom left) EIA. *Forecasts are from the April 2026 EIA Short-Term Energy Outlook and start in 2025. Liquid fuels include crude oil, natural gas, biodiesel and fuel ethanol. WTI crude prices are continuous contract NYM prices in USD. Guide to the Markets – U.S. Data are as of July 15, 2026.
Infrastructure
We view infrastructure as one of the more compelling opportunities within alternatives today, supported by both structural demand and attractive defensive characteristics. The U.S. power grid is undergoing a massive transformation, adding capacity at an unprecedented pace to meet accelerating demand from electrification, reshoring, and the buildout of data centers and AI-related workloads. This transition is driving a sustained, multi-year investment cycle that will benefit operators of essential assets.
Data Center Power Demand Forecasts
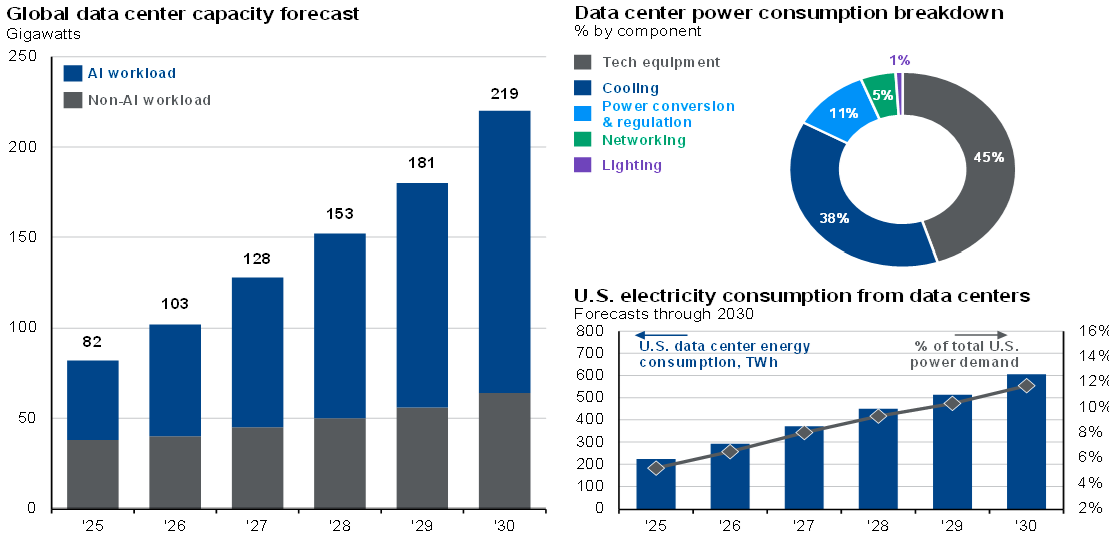
Source: IEEE Communications, McKinsey & Company, J.P. Morgan Asset Management. (Left and bottom right) Forecasts are from McKinsey & Company. (Top right) Data center component breakdown data are from Ahmed, Bollen and Alvarez, “A Review of Data Centers Energy Consumption and Reliability Modeling” (2021).Guide to Alternatives. Data are based on availability as of April 30, 2026.
At the same time, significant funding gaps remain across energy, water, communications and transportation, creating a durable need for private capital and a long runway for deployment.
Infrastructure Funding Gaps
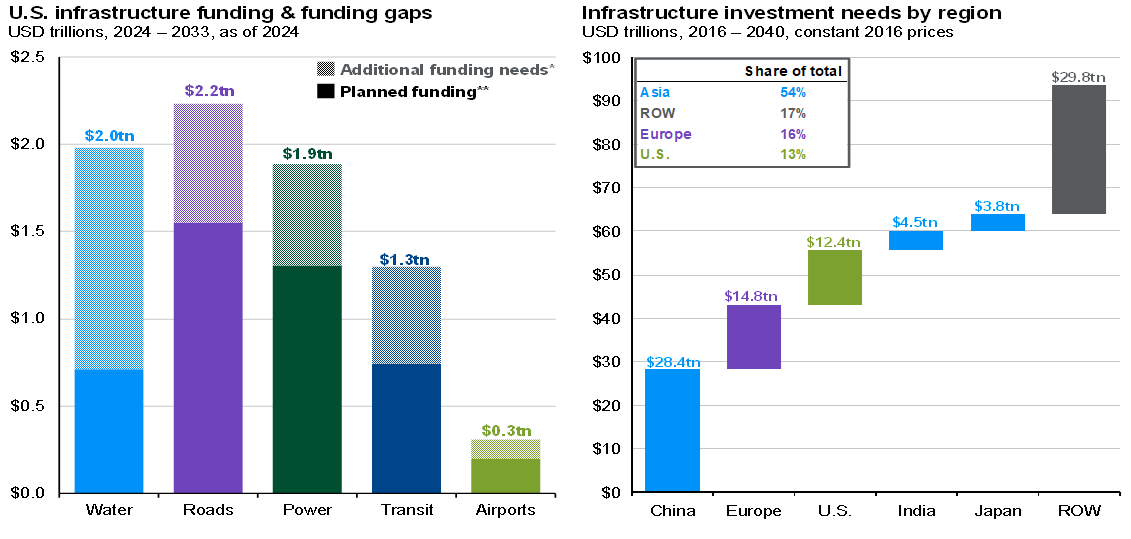
Source: American Society of Civil Engineers (ASCE), Global Infrastructure Hub by G20, J.P. Morgan Asset Management. (Left) Categories defined by the ASCE in the March 2025 “A Comprehensive Assessment of America’s Infrastructure: 2025 Report Card for America’s Infrastructure” report. *Additional funding is the amount of funding needed to get each category to a “B” rating, or a state of “Good” repair, as defined by the ASCE. **Planned public funding is the amount of investment from 2024 to 2033 that is currently in place by U.S. law. (Right) ROW = rest of world.Guide to Alternatives. Data are based on availability as of April 30, 2026.
Infrastructure can also provide defensive portfolio characteristics through stable cash flows and revenues that are often contractually or structurally linked to inflation. These attributes are particularly valuable in an environment of elevated energy prices and persistent macroeconomic uncertainty.
Components of Infrastructure Return
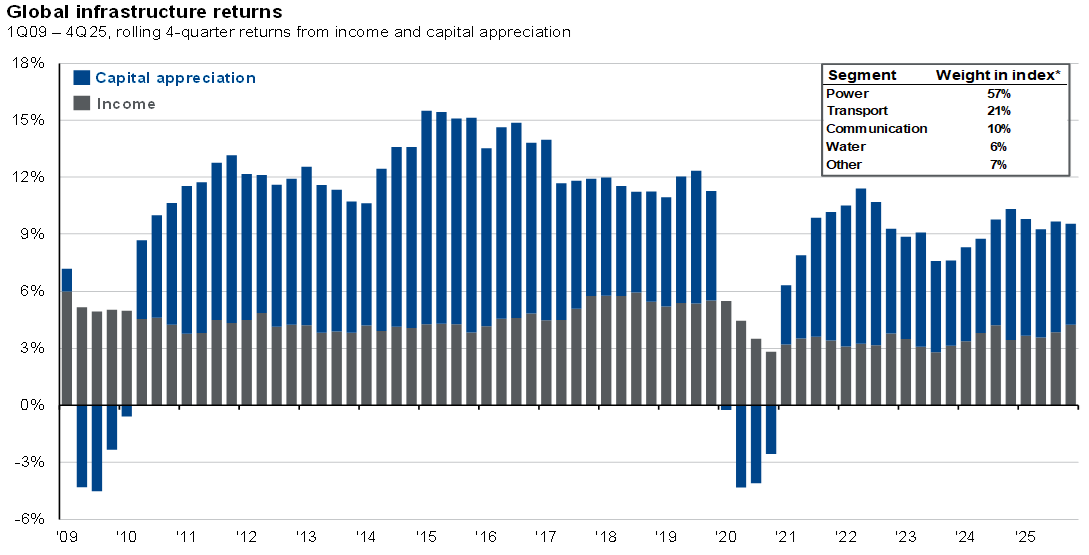
Source: MSCI, J.P. Morgan Asset Management. Infrastructure returns represented by the MSCI Global Private Quarterly Infrastructure Asset Index. Data show rolling 4-quarter returns from income and capital appreciation. *Weights are based on enterprise value and may not sum to 100 due to rounding. Past performance is not a reliable indicator of current and future results. Guide to Alternatives. Data are based on availability as of April 30, 2026.
Private Equity
We remain selectively constructive on private equity, with our highest conviction in the lower-middle market. Skilled managers can acquire companies at more reasonable entry valuations and create value through operational improvements rather than relying primarily on leverage or multiple expansion. We are more cautious on technology and software strategies, particularly 2020 through 2022 vintages, where elevated entry valuations have made exits more difficult.
Private Equity IRR by Vintage Year
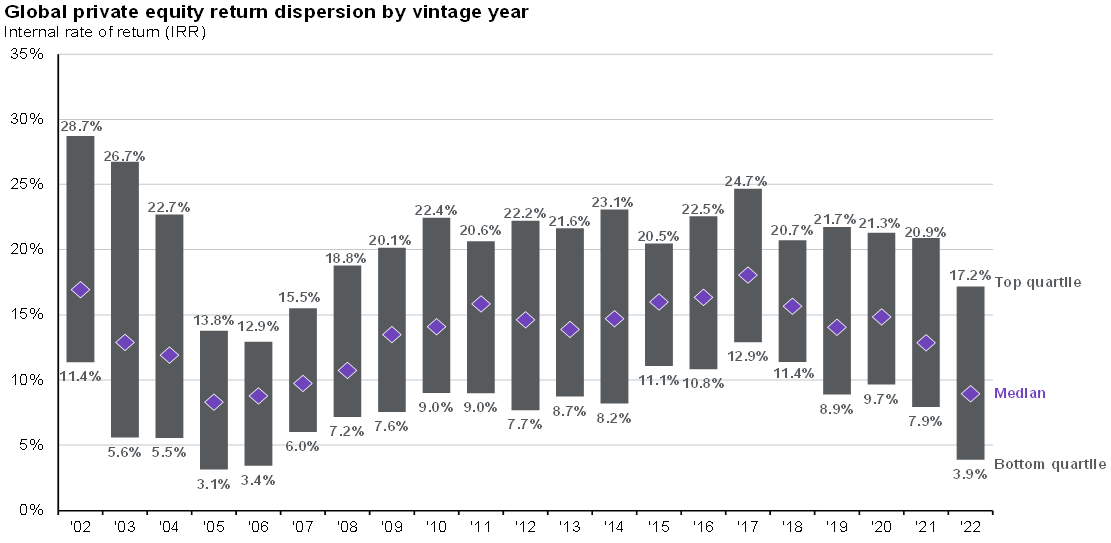
Source: Burgiss, J.P. Morgan Asset Management. Global private equity is represented by global buyout funds. IRR performance data are as of 4Q25. Past performance is not a reliable indicator of current and future results. Guide to Alternatives. Data are based on availability as of April 30, 2026.
Manager selection remains critical. Over the past decade, top-quartile private-equity managers generated returns of approximately 20.5%, compared with 1.3% for bottom-quartile managers, a substantially wider dispersion than in public equities or bonds. We also remain cautious on semi-liquid vehicles, where periodic redemption features can create a mismatch with the liquidity of the underlying assets and may lead to asset sales, additional borrowing or withdrawal limits during periods of elevated outflows.
Public and private manager performance dispersion
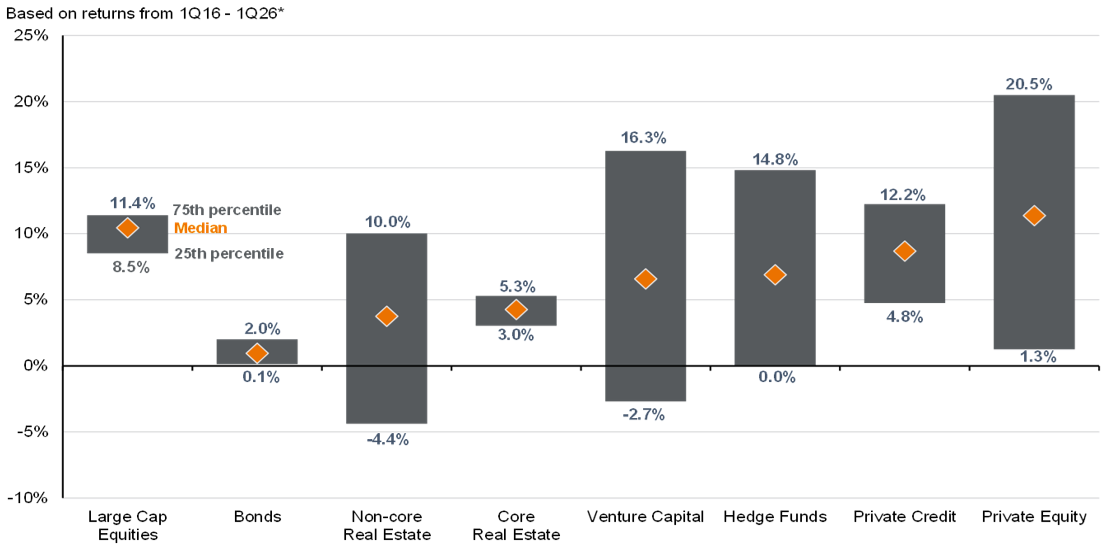
Source: Burgiss, Morningstar, MSCI, PivotalPath, J.P. Morgan Asset Management. All categories are global. Large Cap Equities and Bonds are based on the Morningstar Global Large Stock Blend and Global Bond (not hedged) categories, respectively. Core Real Estate is based on the MSCI Global Property Fund Index. Private Credit, Non-core Real Estate, Private Equity and Venture Capital are based on indices from the MSCI Private Capital Universe. Hedge Funds are based on the PivotalPath index. Manager dispersion is based on annual returns over the 10-year period indicated for: Large Cap Equities, Bonds and Hedge Funds. *Manager dispersion is based on annual returns over the 10-year period ending 4Q25 for Core Real Estate. Manager dispersion is based on the 10-year internal rate of return (IRR) ending 4Q25 for: Private Credit, Non-core Real Estate, Private Equity and Venture Capital. Past performance is no guarantee of future results. This slide comes from our Guide to Alternatives. Guide to the Markets – U.S. Data are as of July 15, 2026.
Private Credit
We are quite cautious on private credit due to concerns over defaults, write downs, exposure to software companies, and valuations. The default of First Brands Group and TriColor revealed the opaqueness of private credit valuation models and potential conflict of interest in fund managers to write down loans that would negatively impact performance. We are also concerned about private credit’s exposure to software and technology companies that may be under threat from AI, with over 38% of the private market being in software and technology. The realities of the lack of liquidity during periods of market stress also set in when considering the market size is only $2.2 trillion vs. the $17.4 trillion in corporate credit between investment grade and high yield debt.
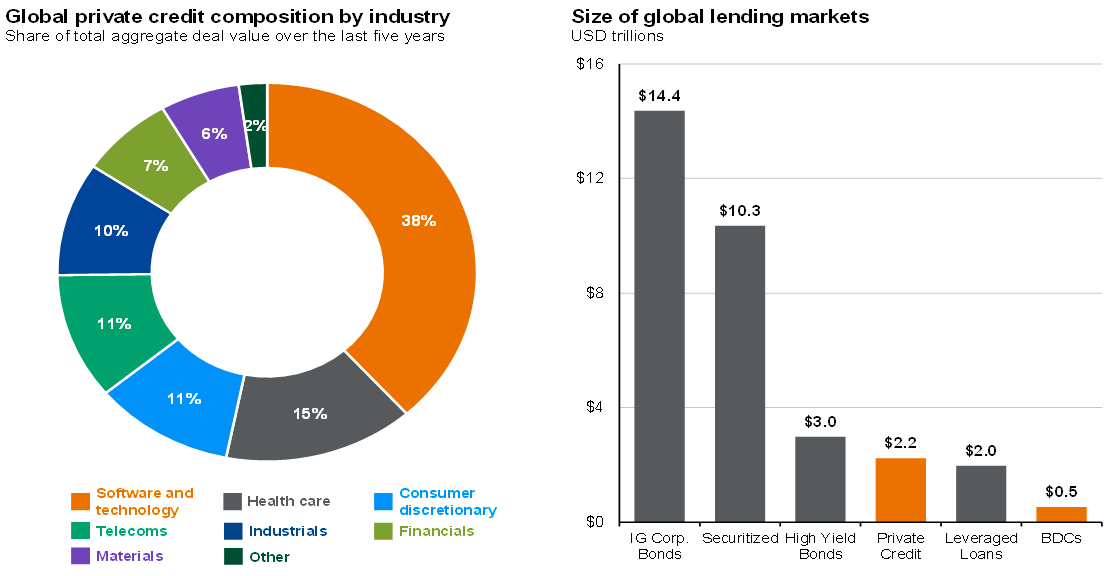
Source: Advantage Data, Bloomberg, Houlihan Lokey, Morningstar, PitchBook Data, Inc., Preqin, J.P. Morgan Asset Management. (Left) Other includes energy and utilities, real estate and non-classified categories. (Right) Size reflects par value outstanding for all bonds and leveraged loan categories. IG Corp. Bonds: Bloomberg Global Aggregate Corporate Index. Securitized: Bloomberg Global Aggregate Securitized Index. High Yield Bonds: Bloomberg Global High Yield Index. Private Credit: AUM for closed-end private credit funds tracked by Preqin. Leveraged Loans: Morningstar Global Leveraged Loan Index. BDCs: Fair value of assets held by publicly traded and privately registered Business Development Companies tracked by Houlihan Lokey’s quarterly “BDC Monitor.”Guide to Alternatives. Data are based on availability as of April 30, 2026.
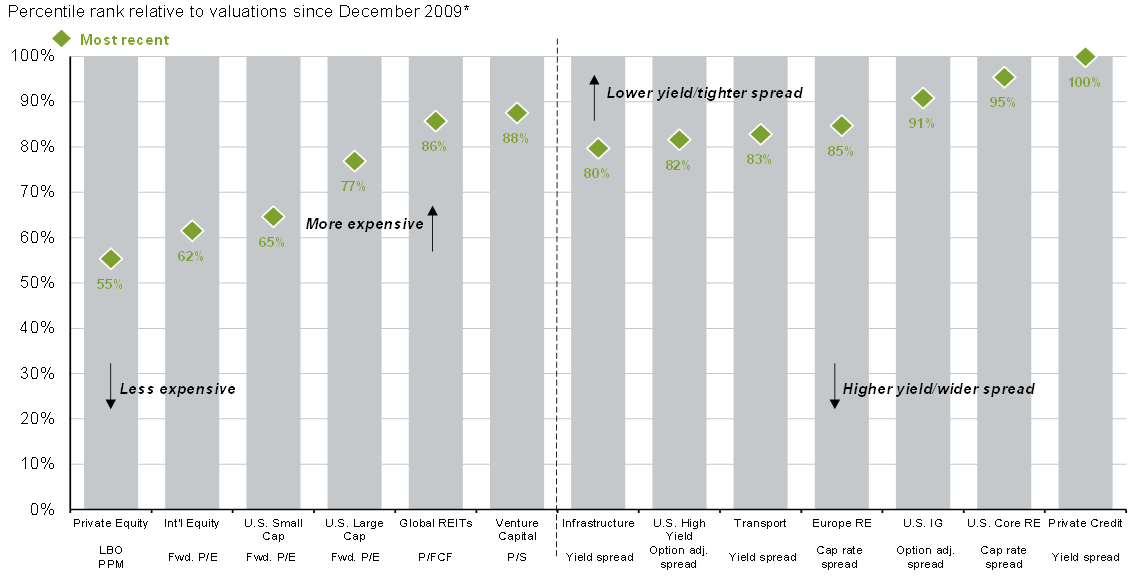
Looking at valuations across the private markets space, private credit has the most stretched valuations out of all the asset classes. Note, private credit did not exist in 2009, so 2021 valuations are used as the reference point for relative valuations.
Valuations across asset classes
Source: Bloomberg, Burgiss, Cliffwater, FactSet, Jay Ritter – Univ. of Florida, KBRA DLD, MSCI, NCREIF, PitchBook Data, Inc., RCA, J.P. Morgan Asset Management. All asset class valuation measures are quarterly and are inclusive of the latest available data, except VC, which is annual. Equity valuations are measured using forward P/E ratios. Fixed income valuations are measured using the option adjusted spread. Global REITs valuations are measured using price-to-free cash flow (P/FCF) multiples. Real estate valuations are measured using the spread between transaction-based cap rates and the yield on the appropriate 10-year government bond. Private equity valuations are determined using leveraged buyout purchase price multiples (LBO PPM). Private credit valuations are measured using the spread between the annualized quarterly income return from the Cliffwater Direct Lending Index from the start of the period to 12/31/2021, and the quarterly yield to maturity from the KBRA DLD Index thereafter, and 3-month SOFR (LIBOR pre-2019). VC valuations measured using the median VC-backed IPO price-to-sales (P/S) ratio. Infrastructure and transport valuations are measured using the spreads between quarterly 12-month trailing cash flow yields and the yield to worst on the Bloomberg U.S. IG Corporate Index. *Global REITs average valuation is since 3/31/2010. Past performance is not a reliable indicator of current and future results.Guide to Alternatives. Data are based on availability as of April 30, 2026.
Ultimately, there are more attractive, safer areas to sit in floating rate debt at this point in the market cycle than in private credit. If or when private credit offers more of a premium over safer alternatives again, then we will reassess.
The US Economy
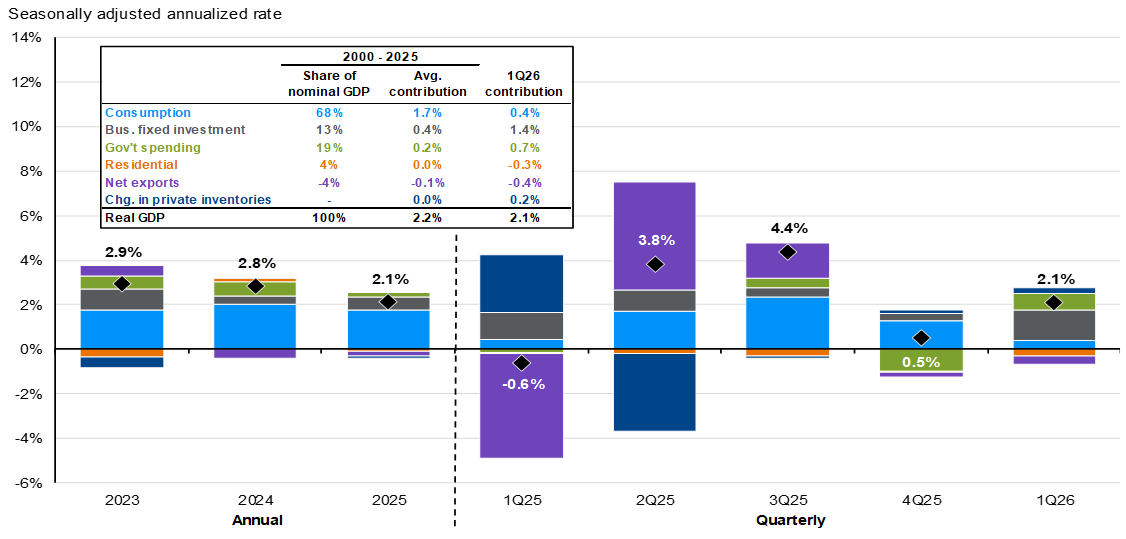
We want to wrap up this mid-year outlook reviewing where the US economy is in the economic cycle. GDP has shifted with capex being the engine driving growth rather than consumer spending in 2026; consumer spending matters since it makes up roughly 67% of GDP whereas capex only makes up 13%. In Q1, consumer spending came in at a paltry 0.4% – a significant departure from the 25-year average of 1.7%.
Contributors to real GDP
Source: BEA, FactSet, J.P. Morgan Asset Management. Guide to the Markets – U.S. Data are as of July 20, 2026
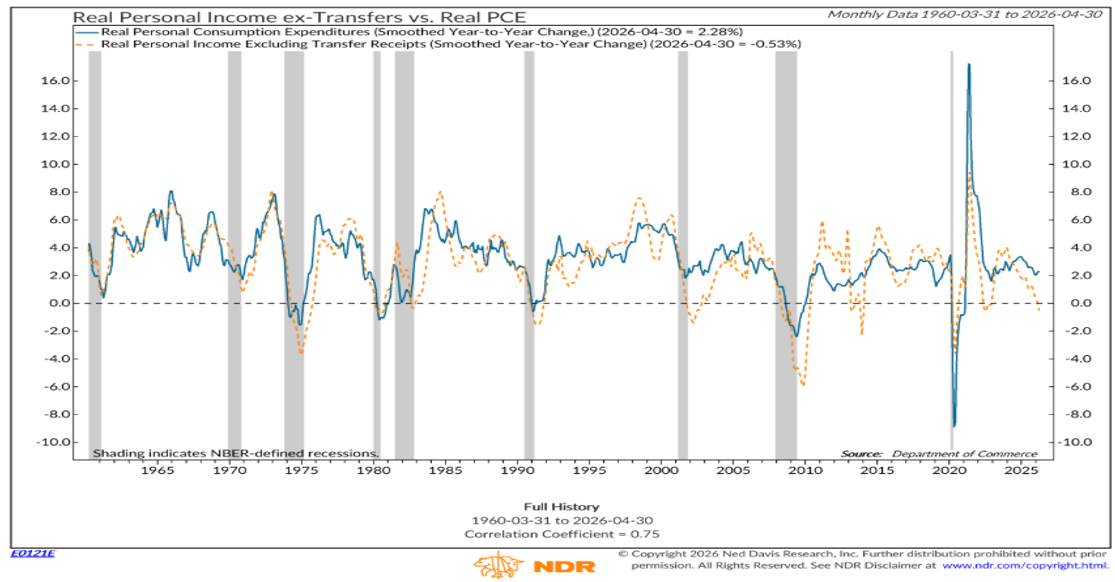
Looking closely at the health of the consumer, real personal income as of April was down -0.53% year over year. Consumer spending typically follows real personal income, so this provides a clue as to where it may be going into the second half of the year. Our base case is for consumer spending to stay below average over the second half of the year.
The decline in inflation adjusted personal income may lead to a pullback in spending
Source: Ned Davis Research. Real Personal Consumption Expenditure vs. Real Personal Income Excluding Transfer Receipts as of April 2026.
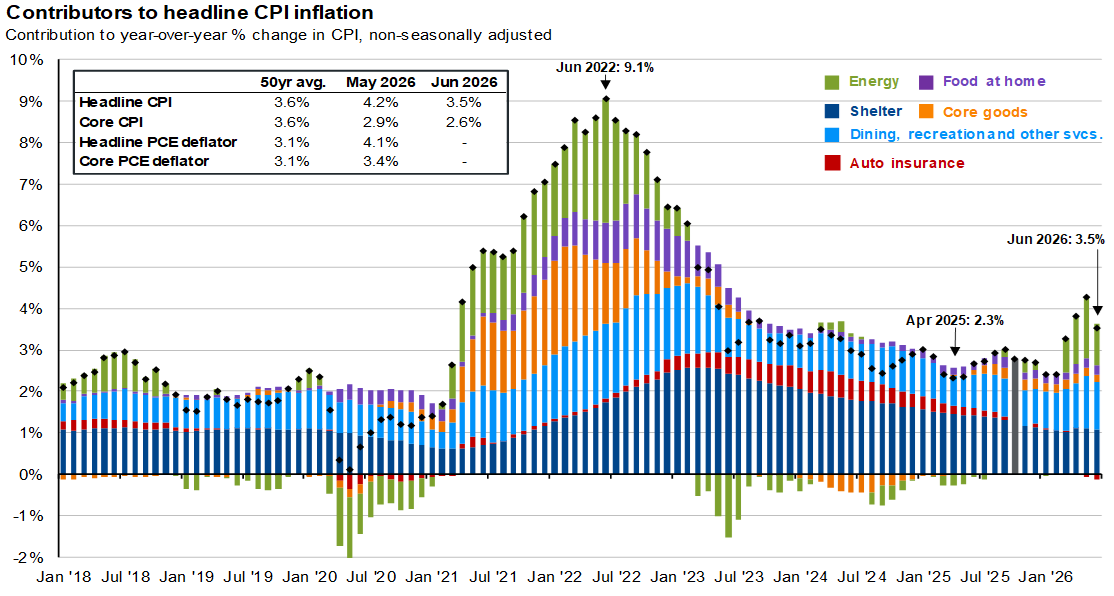
A key contributor to consumers feeling squeezed is inflation. As most already know, energy is the driving force behind the recent rise in inflation; but don’t overlook the stickiness of shelter inflation and services inflation, both of which have struggled to materially come down this year. We expect inflation to remain elevated into year end.
Inflation remains elevated
Source: BLS, FactSet, J.P. Morgan Asset Management. Contributions mirror the BLS methodology on Table 7 of the CPI report. Values may not sum to headline CPI figures due to rounding and underlying calculations. “Shelter” includes owners’ equivalent rent, rent of primary residence and tenants’ and household insurance. “Food at home” includes alcoholic beverages. Headline and core PCE deflator inflation shown are based on seasonally adjusted data due to data availability. Official October 2025 data unavailable due to government shutdown and data shown are J.P. Morgan Asset Management estimates. Guide to the Markets – U.S. Data are as of July 20, 2026.
The good news is the labor market is generally still in equilibrium. The unemployment rate is around 4.2%, which is below the 30-year average of 5.5%. The economy is still adding jobs each month, on average, with job openings holding steady and layoffs/separations remaining low. This could create a situation where the consumer, albeit squeezed, still manages to hold on for some time until a point when the labor market deteriorates.
Labor Market Remains Resilient
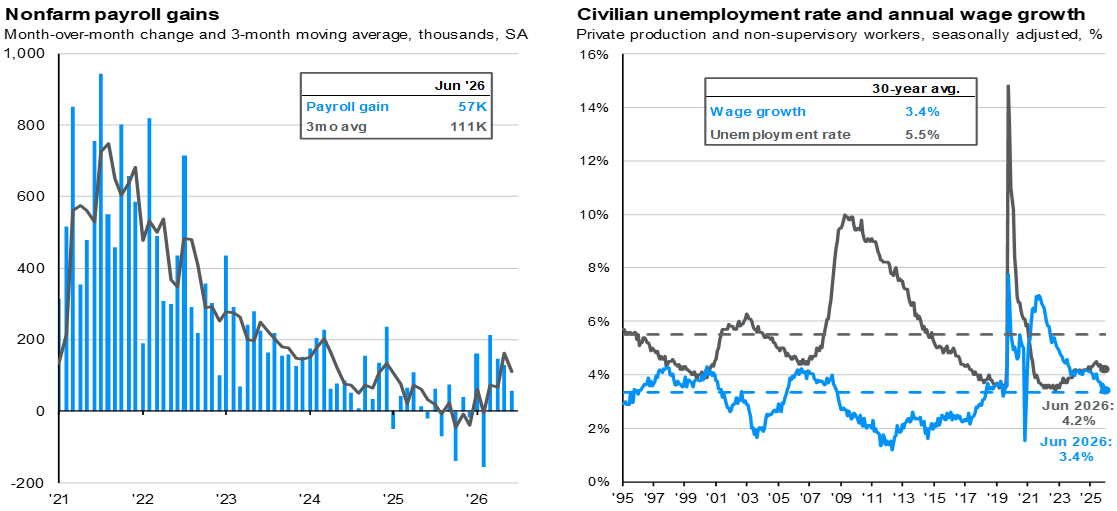
Source: BLS, FactSet, J.P. Morgan Asset Management. Private production and non-supervisory jobs represent just over 80% of total private nonfarm jobs. Guide to the Markets – U.S. Data are as of July 20, 2026.
Another way to gauge future growth prospects is by looking at what purchasing managers’ intentions are – particularly on the service side of the economy as it makes up 73% of GDP. ISM service PMIs is hovering around 54%. This historically translates to 1.4% in GDP growth rate when using data going back to 1997.
US services remain supportive of US economic growth
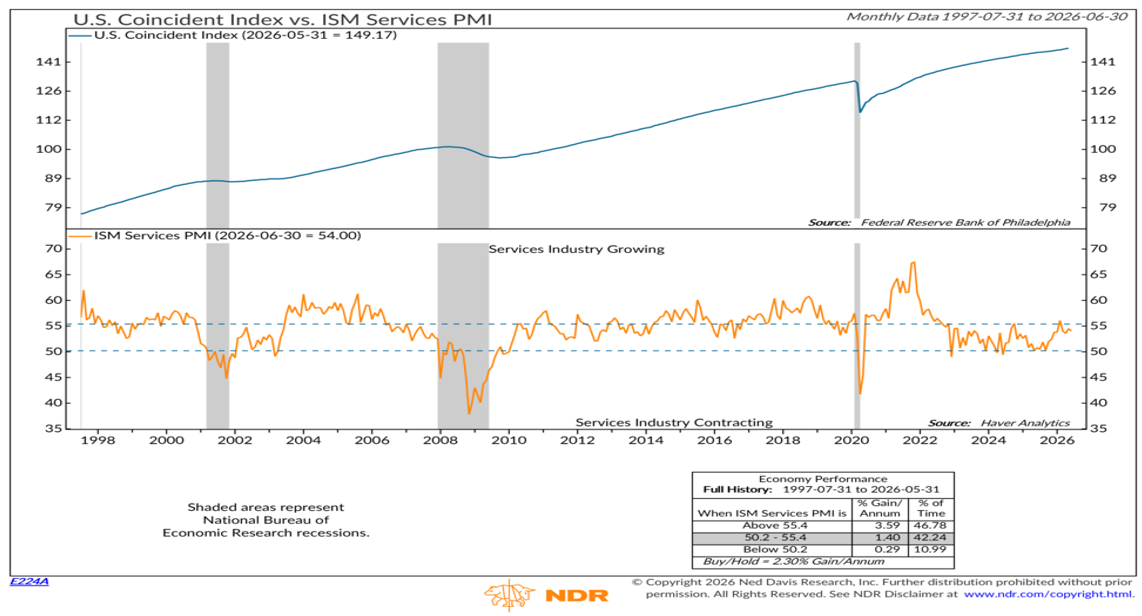
Source: Ned Davis Research. US ISM Services PMI vs. US Coincident Index. As of June 30, 2026.
What to do now
Markets have been especially volatile over the last 6-12 months, yet performance across most asset classes has been relatively strong year to date and the economy is still growing. We find large cap equities, emerging market stocks, and the 2- to 5-year end of Treasury yield curve attractive, while remaining cautious on small cap equities, rate-sensitive assets, and private credit. We remain neutral on gold as it faces headwinds over the near-term while long-term fundamentals hold steady. As always, if you have any questions, then please don’t hesitate to reach out to your financial advisor.
Advus Financial Partners, LLC is an investment advisory firm registered with the Securities and Exchange Commission (“SEC”) under the Investment Advisers Act of 1940. SEC registration does not constitute an endorsement of the firm by the SEC, nor does it indicate that the adviser or investment adviser representative has attained a particular level of skill or ability. The oral and written communications of an adviser provide you with information about which you determine to hire or retain an adviser. For more information please visit: https://adviserinfo.sec.gov and search for our firm name. This commentary has been provided for informational purposes only and is not intended as legal, tax, or investment advice, or as a recommendation of any particular security or strategy. The investment strategy and themes discussed herein may be unsuitable for investors depending on their specific investment objectives and financial situation. Information obtained from third-party sources is believed to be reliable though its accuracy is not guaranteed. Opinions expressed in this commentary reflect subjective judgments of the author based on conditions at the time of publication and are subject to change without notice. Past performance is not indicative of future results. Bonds are subject to market, interest rate and credit risk; and are subject to availability and market conditions. Generally, the higher the interest rate the greater the risk. Bond values will decline as interest rates rise. Government bonds are subject to federal taxes. Municipal bond interest may be subject to the alternative minimum tax; other state and local taxes may apply. High yield bonds, also known as “junk bonds,” are subject to additional risk such as increased risk of default. Some asset-backed securities may have structures that make their reaction to interest rates and other factors difficult to predict, making their prices volatile and they are subject to liquidity and valuation risk. An index is an unmanaged portfolio of specific securities, the performance of which is often used as a benchmark in judging the relative performance of certain asset classes. Investors cannot invest directly in an index. An index does not charge management fees or brokerage expenses, and no such fees or expenses were deducted from the performance shown.